
Evaluations of teaching and student experiences within units and courses are now standard practice in Australian universities. At the unit level, unit evaluation results provide a “snapshot” of students’ perceptions of their unit. One measure of the success of PATS is through the student evaluation instrument. Monash University, and other institutions, use coloured indicators as a display of the measure of overall satisfaction in unit evaluations. Any unit coloured RED means that it is in need of critical attention; ORANGE means the unit is in need of improvement; GREEN means the unit is meeting aspirations and PURPLE means the unit is outstanding.
The original impetus for PATS arose from the national results for the Course Evaluation Questionnaire (CEQ), which indicated that disciplines such as Engineering and Information and Communication Technology (ICT) were not performing as well as other discipline areas on the good teaching scale. Results from 2008 and 2009 unit evaluations at Monash showed that approximately 10% of units within the physical sciences (i.e. ICT, Engineering and Science) scored below 3.0 and were therefore in need of urgent attention.In response, PATS was first piloted in the Faculty of Information Technology at Monash University in 2009. Five units that were identified as in need of critical attention participated in the pilot. As shown in Table 1 below, each of these units moved out of the RED zone after PATS.
Table 1: PATS Pilot: Faculty of IT unit evaluation results 2008-2009
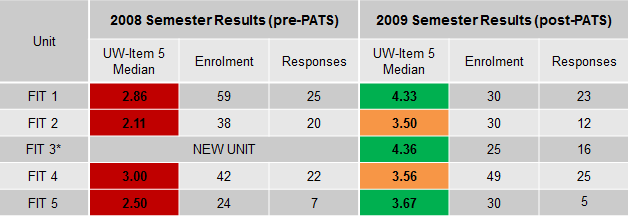
* Participation in the scheme due to previous unit flagged as needing critical attention
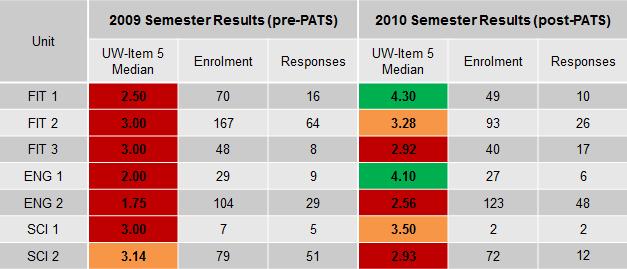
Following the initial success of PATS, in 2010 it was funded by an ALTC Teaching Fellowship and was opened up to all academics who wished to improve the health and quality of their units. As a result, in 2010 PATS was used in another seven units in the Physical Science cluster at Monash University. The unit evaluation results displayed in Table 2 below show that four of the seven units moved out of the RED zone.
Table 2: PATS Physical Science Cluster unit evaluation results 2009-2010
In 2011, 14 units trialled PATS across six Monash faculties. As shown in Table 3 below, all units ended up in either the GREEN or PURPLE zone, indicating students were satisfied with the quality of the units.
Table 3: PATS Monash unit evaluation results 2010-2011
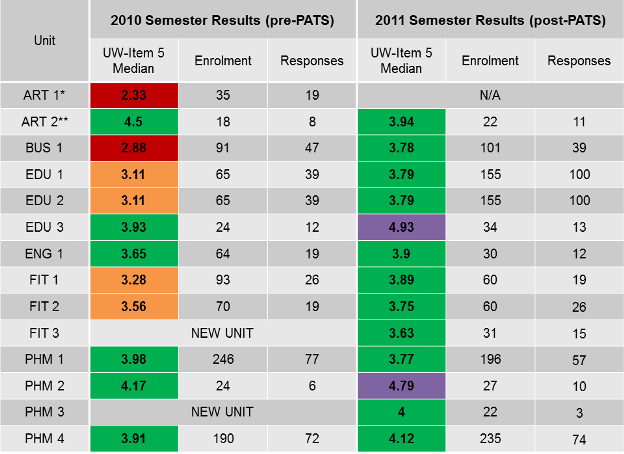
* Unit not taught in 2011, the partnership used the scheme as a way to prepare for future iterations of the unit.
** This unit was delivered for the first time in 2010. The previousversion of the unit was in the critical attention zone.
In 2012, the Council of Australian Directors of Academic Development provided funding to support the expansion of PATS to four other universities nationwide.
Changes in unit evaluation results for the ‘overall satisfaction’ question were measured across 25 units. Monash University, University of Newcastle, Griffith University and the University of the Sunshine Coast (USC) all use a 5-point Likert scale. Monash uses a median value, while the other universities all use mean values. Edith Cowan University (ECU) uses a 100-point scale, but for purposes of comparison and consistency, this has been converted into a 5-point scale.
Table 4: PATS Monash unit evaluation results 2012
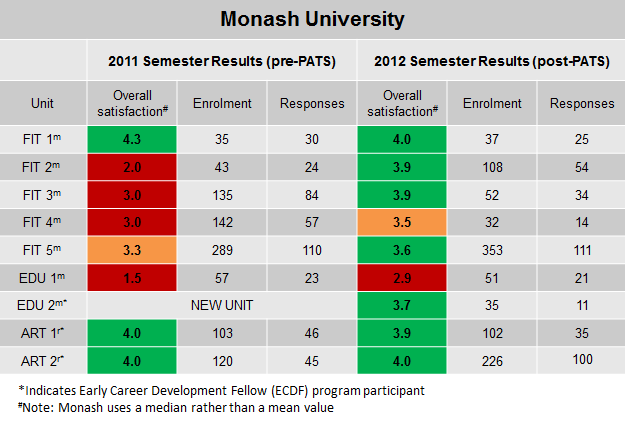
Of the Monash units participating in PATS, all improved their zone or stayed in the same zone, as shown in Table 4. After PATS, seven of the nine units ended in the GREEN zone indicating that students were satisfied with the quality of the units.
Table 5: PATS Newcastle unit evaluation results 2012
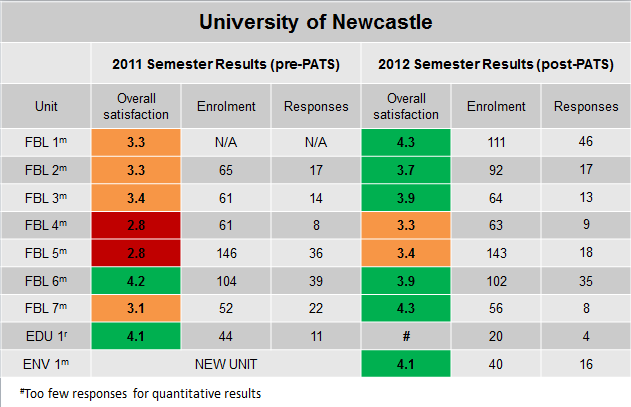
At the University of Newcastle, all of the units improved or maintained their zone. As seen in Table 5, six of the units ended in the GREEN zone after participating in PATS.
Table 6: PATS Griffith unit evaluation results 2012
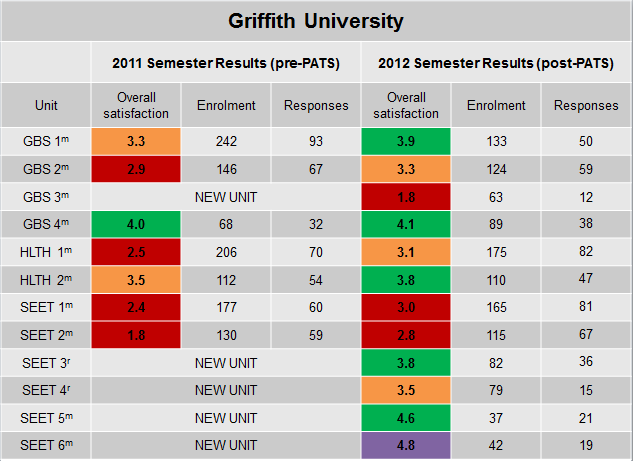
At Griffith University, all of the units improved their score for overall student satisfaction after a semester of PATS. Six of the twelve units ended in the GREEN or PURPLE zone, as shown in Table 6.
Table 7: PATS ECU unit evaluation results 2012
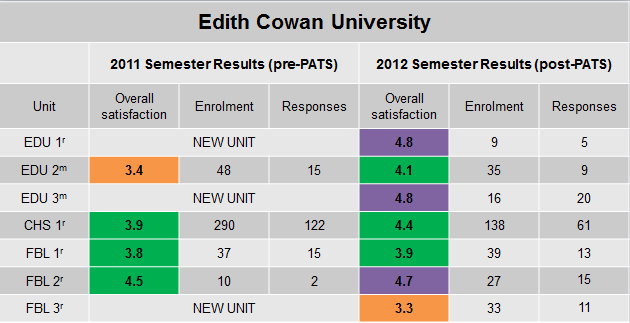
Of the Edith Cowan units, all improved their score on overall student satisfaction, as shown in Table 7. Six of the seven units ended in the GREEN or PURPLE zone indication high student satisfaction with the units.
Table 8: PATS USC unit evaluation results 2012
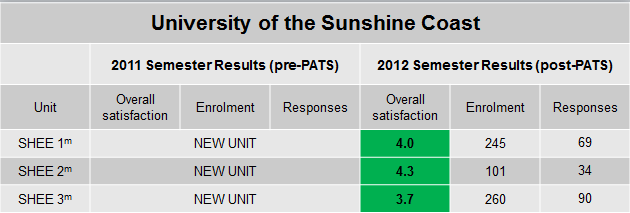
As shown in Table 8 above, the three units participating in PATS at University of the Sunshine Coast all ended in the GREEN zone. This indicates that students were satisfied with the quality of the units.